

Imagine walking through a production line and watching two different operators perform the same job, but with noticeably different motions, timing, and even steps. One may take longer breaks between tasks. Another may walk an extra few feet with each cycle. While both may get the job done, this kind of variation introduces inefficiencies, inconsistencies in quality, and complications in training new team members.
That’s where Standardized Work Charts come in.
Standardized work charts are powerful visual tools that define the most efficient, safe, and repeatable way to perform a task. They help teams identify the ideal process, document it, and communicate it clearly to everyone involved. More than just a diagram, these charts are foundational to lean manufacturing driving consistency, reducing waste, and serving as a baseline for continuous improvement.
A Standardized Work Chart is a visual management tool utilized as a representation of how a specific task should be performed by an operator in a given workstation. Unlike written work instructions, standardized work charts are concise and designed to be understood at a glance by organizing and displaying key process information to stakeholders who may not have the time or interest to review individual, in-depth analyses.
A standardized work chart typically includes:
These elements combine to create a single-page reference that supports training, improves performance, and helps to eliminate unnecessary movement or variation.
By making the standard visible, these charts help operators understand not just what to do, but why they do it that way reinforcing safety, efficiency, and quality across the production floor.
Standardized work charts are more than just helpful diagrams, they are key enablers of lean manufacturing. At the heart of lean is the elimination of waste and the pursuit of continuous improvement. To achieve this, you first need a clear, stable process and that’s exactly what standardized work charts provide.
By defining the most efficient and repeatable method to complete a task, these charts:
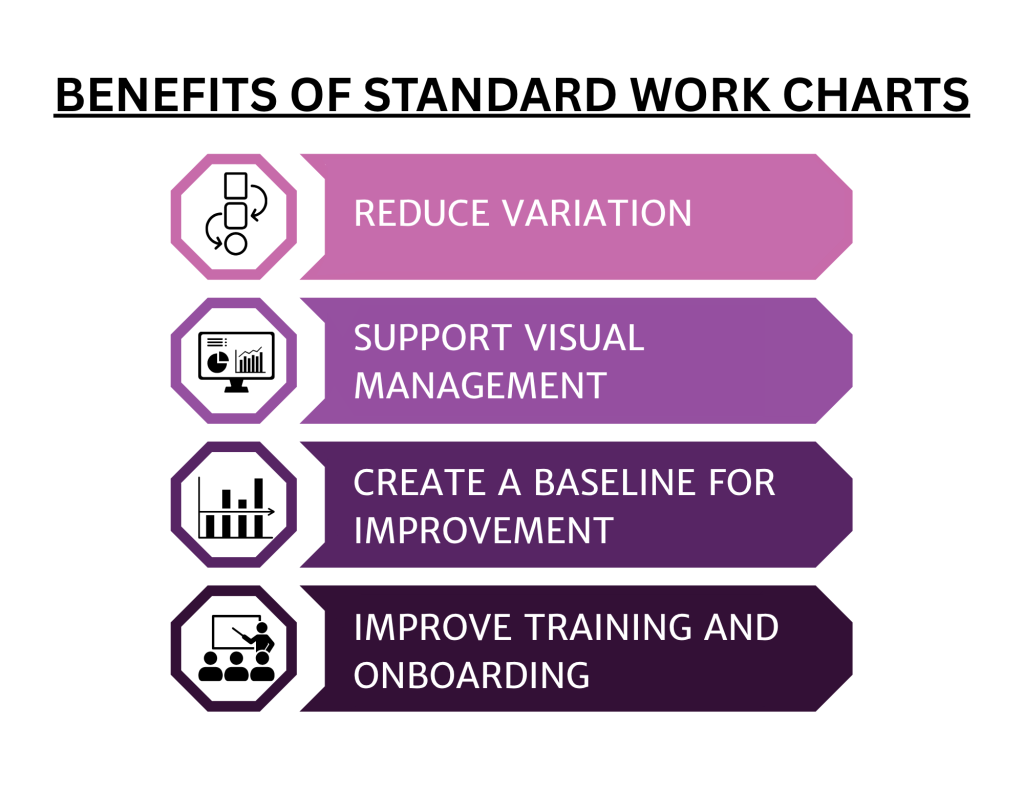
In lean environments, standardized work is often considered the foundation of all improvement efforts. Without it, improvements are harder to measure, sustain, and scale. The standardized work chart makes that foundation visible and actionable.
Standardized work charts are ideal for any repetitive manual task, especially in manufacturing, assembly, and packaging environments. If you have an operation where consistency, cycle time, and quality matter you can likely benefit from this tool.
Here are some common situations where standardized work charts add value:
While standard work charts are most commonly used in production settings, the concept can also be adapted for logistics, warehousing, and even service-based tasks. If the work is repeatable and prone to operator variation, it’s a candidate for standardization.
Creating a standardized work chart may seem complex, but it follows a clear and logical process. Here’s how to get started:
Start by calculating your takt time: the maximum allowable time to produce one unit based on customer demand. This sets the pace for the process.
Watch how the task is currently performed. Break it down into discrete steps and time each one. Note both value-added work and any motion or waiting time.
Write down the steps in the order they should be performed. This should reflect the most efficient and safe method currently known.
Using a layout of the workstation, identify different operations with symbols and draw the operator’s movement throughout the cycle.
Combine all the above into a single-page visual. This can be hand-drawn, created using Excel, or developed in layout software like AutoCAD.
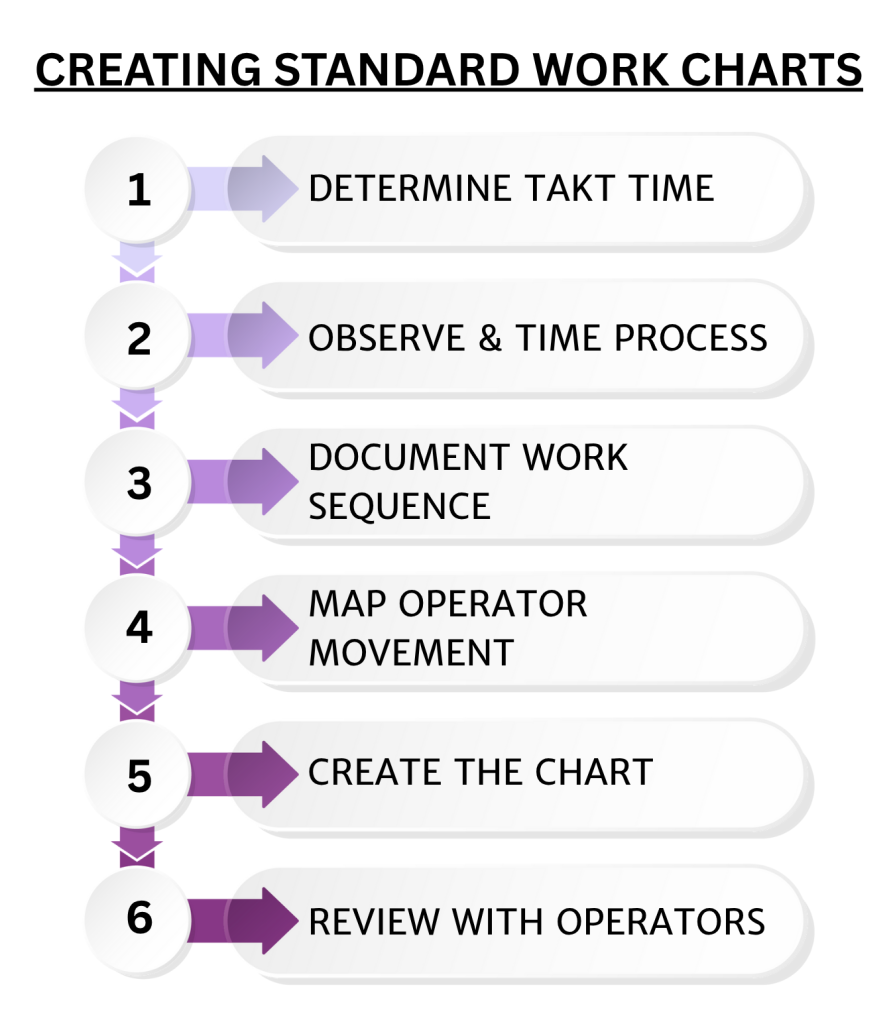
Before finalizing, review the chart with those who perform the work. Their input is critical, they know the realities of the job and may spot errors or improvements.
The result should be a clear, easy-to-read visual that reflects the best-known way to do the work and that can serve as a baseline for training, audits, and improvement.
While standardized work charts are simple in concept, several common mistakes can limit their effectiveness – or even cause more confusion. Here’s what to watch for and how to avoid it:
Creating a chart in isolation, without input from the people doing the work, is a recipe for failure. Operators often know the real issues, shortcuts, and workarounds that aren’t obvious from observation alone.
Solution: Always involve operators in the documentation and review process. Their buy-in and feedback are crucial to creating a chart that’s accurate and respected on the floor.
Trying to include too much detail or using unclear symbols can make the chart harder to read, defeating its purpose as a quick visual reference.
Solution: Keep it simple. Focus on the key information: sequence, movement, and process time. Use a clean, consistent format with a legend if needed.
Once created, charts often get posted and forgotten, even after process changes. That leads to outdated documentation and potential confusion.
Solution: Make standardized work charts living documents. Review and update them regularly, especially after process changes, improvements, or audits.
If supervisors and team leads aren’t referencing the chart or using it to guide training, it loses its authority and relevance.
Solution: Integrate the chart into daily routines, shift startup meetings, audits, new hire training, and problem-solving sessions.
Standardized work charts aren’t just useful in isolation, they’re part of a larger industrial engineering toolkit focused on optimizing productivity, safety, and flow.
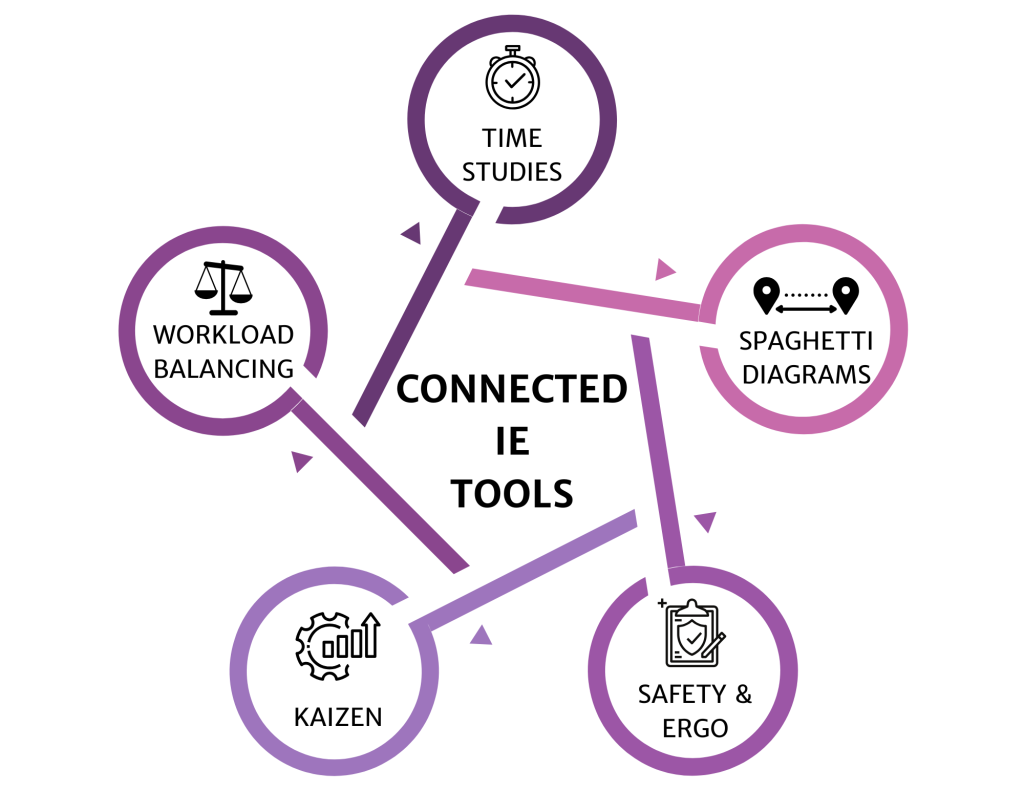
Here’s how they connect to other tools and strategies:
In short, standardized work charts give structure to otherwise fluid, variable tasks. They provide a baseline that makes everything else, from layout optimization to workforce training, more effective and measurable.
Standardized work charts are one of the most practical tools you can implement to improve performance on the shop floor. They bring clarity to operator tasks, reinforce safety, and reduce variation, all while supporting lean initiatives and continuous improvement.
If you’re not currently using standardized work charts, now is the time to evaluate where they could bring structure and stability to your processes. And if you’ve tried them before but didn’t see results, consider revisiting your approach starting with involving your operators and integrating the chart into daily routines.
Contact us to learn how our engineering team can help you document, improve, sustain, and drive performance on your shop floor.
Contact Us