
Designing an efficient facility layout is more than just placing equipment or departments where they fit, it’s about creating an arrangement that supports your operations. One of the key steps in this process is understanding how different activities relate to each other. Whether you’re building a new layout from scratch or improving an existing one, identifying the relationships between your departments can dramatically improve efficiency and communication.
That’s where the Activity Relationship Chart (ARC) comes in. This simple yet powerful tool helps you visualize and prioritize the closeness between departments or functions based on how they interact. In this article, we’ll explore what an ARC is, how to build one, and how to use it to guide your layout decisions.
An Activity Relationship Chart is a visual tool used in facility layout planning to identify and evaluate the closeness requirements between different functions, departments, or workstations. Instead of relying on guesswork or assumptions, it provides a structured way to document how closely two activities should be located based on their interactions and shared needs.
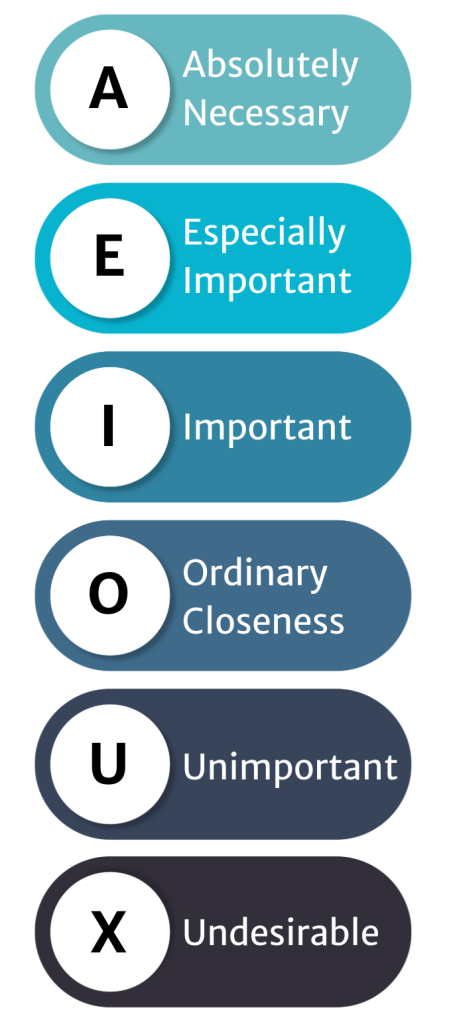
Typically shown as a matrix, the ARC uses a series of letter codes to indicate the degree of importance of proximity between each pair of activities. These codes help layout planners make informed decisions when developing or revising a facility layout.
The core of the Activity Relationship Chart lies in the relationship codes used to rank each pair of activities. These standardized letters represent how critical it is for two areas to be close together:
In addition to assigning a letter code, it’s best practice to include a reason for each rating, this ensures decisions are traceable and that others reviewing the chart can understand the logic behind each rating.
An Activity Relationship Chart is especially valuable during times of change or growth within your operations. Whether you’re designing a new facility, rearranging an existing space, or trying to improve flow, an ARC gives you a structured way to prioritize how close different areas should be.
Key moments to use an ARC include:
By visualizing how activities relate, the ARC helps reduce unnecessary material handling, shorten travel distances, and improve communication, all of which contribute to a more efficient and productive layout.
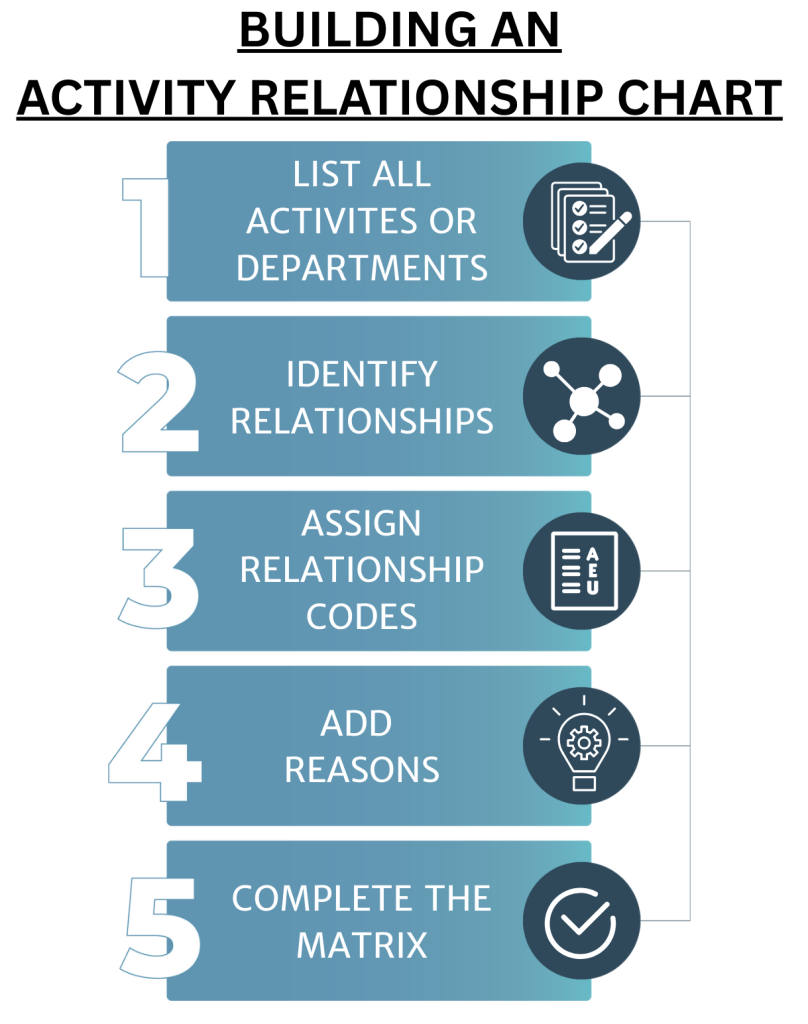
Creating an ARC is a straightforward but collaborative process. Here’s how to build one step by step:
1. List all activities or departments.
Start with a clear list of all areas you want to evaluate: production lines, storage zones, offices, inspection stations, etc.
2. Identify relationships.
For each pair of activities, assess how important it is for them to be located close together. Consider:
3. Assign relationship codes.
Use the ARC scale (A, E, I, O, U, X) to represent the degree of desired closeness. Remember to base your decisions on data, observation, or stakeholder input, not assumptions.
4. Add reasons.
Each rating should be accompanied by a short explanation (e.g., “shared forklift,” “noise concerns,” “daily supervision”).
5. Complete the matrix.
Plot the codes and reasons into a matrix format. The result is a clear, at-a-glance reference that shows which departments need to be near each other and which should be kept apart.
Once your ARC is complete, the next step is to use it as a decision-making guide for your facility layout. Each code in the chart acts like a priority score that tells you how closely two areas should be placed near each other.
Here’s how to apply it:
Many layout planners combine the ARC with tools like spaghetti diagrams or from-to charts to finalize layouts. You may also convert ARC data into a relationship block diagram, where you group activities into a bubble layout according to closeness, a helpful visual before you begin moving walls or equipment.
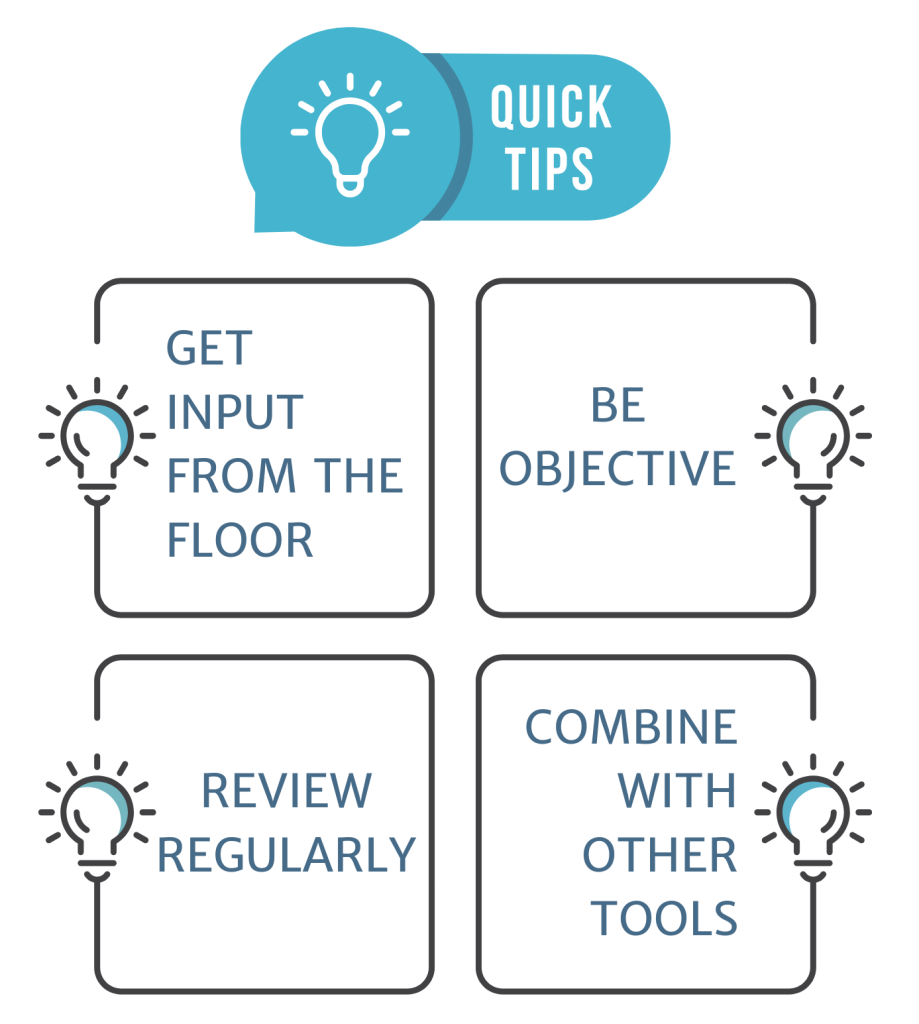
To get the most value from your ARC, consider the following tips:
Even though the ARC is simple to create, it can lose value if used incorrectly. Watch out for these pitfalls:
An Activity Relationship Chart is a foundational tool for facility layout planning. It helps teams define, visualize, and prioritize which activities should be located close to each other and which ones shouldn’t. By using relationship codes based on actual operational needs, you can create layouts that reduce wasted motion, improve material flow, and support communication across departments.
Whether you’re redesigning a plant floor, expanding a warehouse, or building a new facility from the ground up, starting with an ARC can lead to smarter, more strategic decisions.
We can help you map out your activity relationships and design a layout that works. Contact our team to start optimizing your facility with data-backed planning tools like the Activity Relationship Chart.
Contact Us